
Framingham, US: The global Ethernet switch market (Layer 2/3) recorded $6.8 billion in revenue in the Q1, 2019, a 7.8% increase year over year (Y-o-Y). Meanwhile, the worldwide total enterprise and service provider (SP) router market revenues grew 8.2% Y-o-Y in Q1, 2019 to $3.6 billion. These growth rates are according to results published in the International Data Corporation (IDC) Quarterly Ethernet Switch Tracker and IDC Quarterly Router Tracker.
Ethernet Switch Market Highlights
From a geographic perspective, the Q1, 2019 Ethernet switch market had a strong quarter across the globe. The Asia/Pacific (excluding Japan) (APeJ) region grew 8.6% Y-o-Y. Notable gains in the region included China, which grew 11.7% Y-o-Y and Taiwan, which increased 15.3%, while, Japan’s Ethernet switch market rose 1.3%.
The Middle East and Africa (MEA) region saw 9.5% growth Y-o-Y, led by Egypt, which rose 17.3%. Europe saw more modest growth with Western Europe growing 3.5% and Central and Eastern Europe remaining stagnant with 0.3% Y-o-Y growth. Notable markets in Western Europe included the United Kingdom, which was down 1.2% from a year earlier, while Germany was up 2.3% and Italy grew 15.5% Y-o-Y.
In Central and Eastern Europe, Russia declined 13.4% Y-o-Y. In the Americas, the United States grew 11.9% while Canada increased 2.6% Y-o-Y. Latin America was down 4.5% overall with Brazil’s 8.5% Y-o-Y decline offset by 11.0% growth in Mexico.
“Organizations across the globe are looking to digitally transform themselves in an effort to meet market and competitive needs and improve user experiences. As they do so, enterprises are realizing the critical role the network plays in their broader IT transformation initiatives,” said Rohit Mehra, VP – Network Infrastructure, IDC. “This has led to continued, and growing, investment in Ethernet switching, routing, software-defined networks (SDN), and SD-WAN platforms and architectures that support the increasing demands of an always-connected world.”
100Gb Ethernet switch revenues continue to grow rapidly. Port shipments for 100Gb switches rose 85.3% Y-o-Y to 3.6 million. 100Gb revenues grew 59.0% Y-o-Y in Q1, 2019 to $1.2 billion, making up 17.3% of the market’s revenue.
25Gb ports also saw impressive growth, increasing 133.3% to $304.0 million, with port shipments growing 104.8% Y-o-Y. 40Gb switches continue to be falling out of favor with revenues declining 21.3% Y-o-Y. Lower-speed campus switches, a more mature part of the market, showed moderate growth.
10Gb port shipments rose 8.6% Y-o-Y to make up 28.7% of the market’s revenue. 1Gb switches grew 2.9% Y-o-Y in port shipments, making up 40.3% of the market’s total revenues.
Router Market Highlights
The worldwide enterprise and service provider router market grew 8.2% on a year-over-year basis in Q1, 2019 with the major service provider segment, which accounts for 75.3% of revenues, increasing 7.1% and the enterprise segment of the market growing 11.9%.
From a regional perspective, the combined service provider and enterprise router market increased 12.0% in APeJ with the enterprise segment up 17.7%. Japan’s total market grew 27.1% Y-o-Y. Central and Eastern Europe regional revenues rose 19.7% Y-o-Y, while the Western Europe combined enterprise and service provider market grew 3.7% Y-o-Y.
The Middle East & Africa region was up 12.6% fueled by a 15.7% increase in service provider revenues. In the U.S., the enterprise segment was up 15.7% but the service provider revenues fell 5.8%, causing the total market to decline 0.5% Y-o-Y. Canada’s market rose 28.5% Y-o-Y and the Latin American market grew 9.0%.
Vendor Highlights
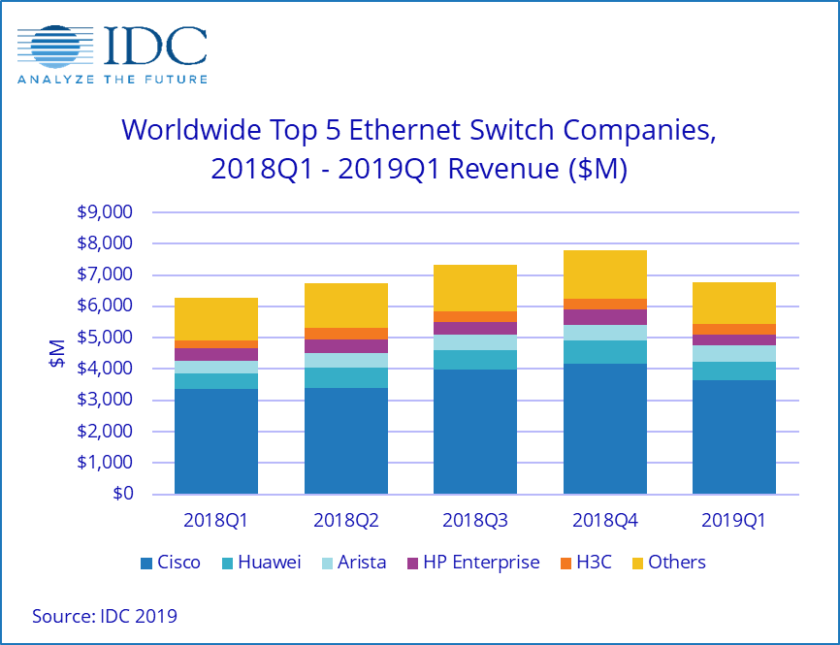
Cisco finished Q1, 2019 with an 8.3% Y-o-Y increase in overall Ethernet switch revenues and market share of 53.7%. In the hotly contested 25Gb/100Gb segment, Cisco is the market leader with 39.4% of the market’s revenue. Cisco’s combined service provider and enterprise router revenue rose 15.3% Y-o-Y, with enterprise router revenue increasing 16.1% and service provider revenues growing 14.8%. Cisco’s combined SP and enterprise router market share increased to 42.4%, up from 37.4% in Q4, 2018.
Huawei‘s Ethernet switch revenue rose 18.9% on an annualized basis, giving the company market share of 8.9%, up from 8.1% a year earlier. The company’s combined service provider and enterprise router revenue rose 5.7% Y-o-Y with a market share of 24.5%.
Arista Networks saw Ethernet switch revenues increase 24.0% in Q1, 2019, bringing its share to 7.5% of the total market, up from 6.5% a year earlier. The company continues to cater to the higher end of Ethernet switch speeds, with 100Gb revenues accounting for 67.6% of the company’s total revenue, indicating the company’s focus on hyperscale and cloud providers.
HPE‘s Ethernet switch revenue declined 5.6% Y-o-Y, giving the company a market share of 5.3%.
Juniper‘s Ethernet switch revenue declined 23.4% in Q1, 2019, bringing its market share to 2.6%. Juniper saw an 8.2% decline in combined enterprise and service provider router sales, bringing its market share in the router market to 10.4%.
“There continue to be diverging trends across the Ethernet switch market,” said Petr Jirovsky, Research Director – IDC Networking Trackers. “Hyperscalers and service providers continue to demand the fastest Ethernet switching speeds in the market, leading to the highest growth rates in both port shipments and revenues. Meanwhile, the more mature enterprise switching platforms continue to make up a larger share of the overall market.”
The IDC Quarterly Ethernet Switch Tracker and the IDC Quarterly Router Tracker provide total market size and vendor shares for the Ethernet switch and router technologies.
The geographic coverage for both the Ethernet switch market and the router market includes eight major regions (USA, Canada, Latin America, Asia/Pacific (excluding Japan), Japan, Western Europe, Central and Eastern Europe, and Middle East and Africa) and 60 countries.
The Ethernet switch market is further segmented by speed (100Mb, 1000Mb, 10Gb, 25Gb, 40Gb, 50Gb, 100Gb), product (fixed managed, fixed unmanaged, modular), and layer (L2, L3, ADC).